• Published on

    Most CSSHP growers have tried Cover Crops.

    Picture
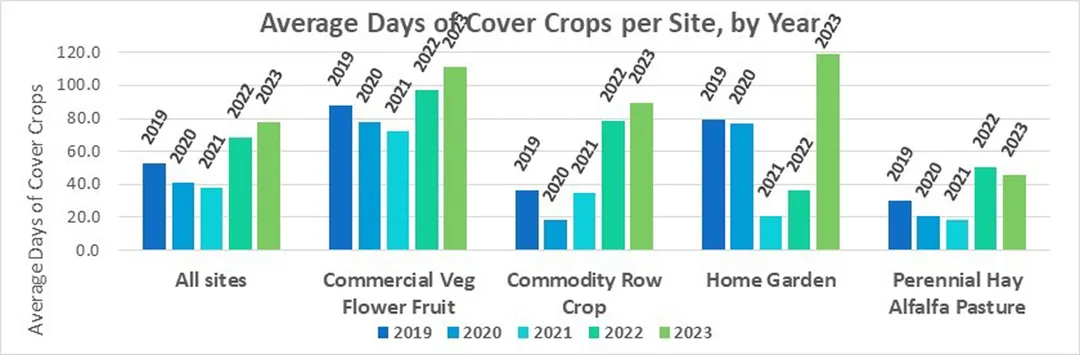
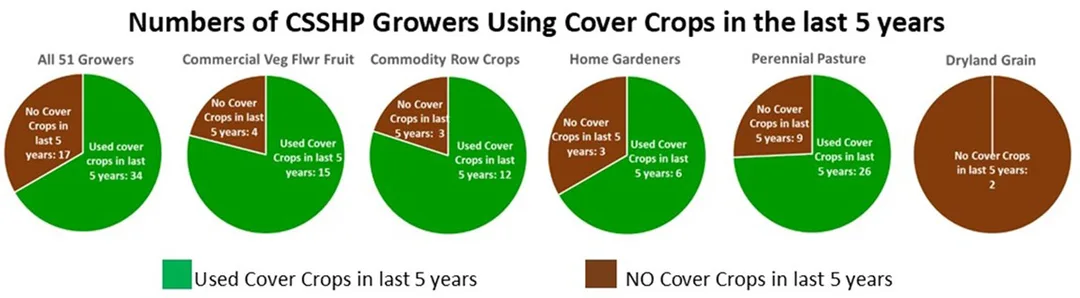
    Two thirds of all our growers have planted cover crops in the last 5 years, with Commercial Vegetable and Commodity growers leading the way.  Only when a rancher inter-seeds a cover into an existing pasture or reseeds an annual field into a perennial crop do we credit a cover crop to that site, so we expect that cover crop use would be low for many of our established Perennial Hay/Alfalfa/Pasture sites.  Dryland grain sites, which depend on 420 days of fallow soil to store enough soil moisture for a biennial small grain crop, avoid cover crops because cover crops can deplete soil moisture.
  • Published on

    Average Days of Cover Cropping has increased.

    Picture
    Our growers have increased their days of cover crops on average by 25 days/site since 2019.  We examined the 200 sites for which we have cover crop data and found that our growers’ Cover Crop Use has increased for almost all our crop categories including Commercial Veg/Flower/Fruit, Commodity Row Crops, and Home Gardens. 
  • Published on

    Average Days of Living Cover has increased.

    Picture
    We have 5 years of data on the 51 sites which have been in the project since the very beginning, with data on both their management practices as well as their soil testing results.  The average Days of Living Cover on these 51 sites has increased by 20 days since 2019.  Our growers have increased their Days of Living Cover by increasing their use of cover crops, converting annual crops to perennial systems, and incorporating more fall-planted small grains into their rotations.
  • Published on

    Our Growers have made progress!!

    Picture
    The variability we continue to see in our lab results has thrown a great big monkey wrench into our ability to assess progress using only our lab results. However, we can still assess the progress our growers have made in increasing their use of tried-and-true soil health practices, including:
    • Increasing their Days of Living Cover
    • Increasing their use of Cover Crops
    • Decreasing their Tillage Intensity
    • Increasing their Organic Matter Inputs
    Our growers have made excellent progress incorporating 3 out of 4 of these soil health practices in the last 5 years.
  • Published on

    Predicting the Soil Health of 7 Different Crop Groups: PART 1

    Predicting the Soil Health of 7 Different Crop Groups: PART 1
    For each of our 7 crop groups, we calculated their average use of 6 different parameters that effect soil health: days of supplemental irrigation water, days of living cover, tons of organic matter added, number of grazing days, their tillage intensity score, and their soil Ph. 
    We then examined those averages to see if we could predict which crop groups would have the lowest and highest soil health scores.  The graphs above show the average soil health practices for all 7 crop groups.  See if you can predict which crop groups will have the best and worst soil health scores, just by looking at their relative rankings on soil health practices.  Remember that you are looking for HIGH water days, HIGH days of living cover, HIGH organic matter inputs and HIGH grazing days, but LOW tillage intensity and LOW soil pH to predict the highest soil health scores. It’s just the opposite for the lowest soil health scores.