• Published on

    Variability with 2 Consecutive Years of Grazing or Organic Matter Inputs

    Variability with 2 Consecutive Years of Grazing or Organic Matter Inputs
    We sorted our sites into 3 groups and calculated the average variability for each group.  This bar graph shows that the groups which grazed animals or added organic matter to their sites for 2 consecutive years have approximately three times as much variability in their lab results as the group with NO grazing animals and NO organic matter inputs.
  • Published on

    Characteristics of Highly Variable Sites

    Image description
    We examined our 28 sites which have the most variability in their soil health scores.  We call these sites our “Swingers”, and they are evenly split between organic and conventional growing methods. 
    Over half the “Swinger” sites are pastures with the rest split evenly between home gardens and commercial vegetable sites.  Their most common crop is grass hay with mixed vegetables coming in second. Their average water season is 127 days long.  “Swinger” sites have an average soil health score of 27.6, which is very high, especially for Colorado.  The growers of these “Swinger” sites are all Soiley Award winners or nominees.  They have adopted many soil health practices, as you can see in the following graph.
    Characteristics of Highly Variable Sites
    The lesson here seems to be that no good deed goes unpunished.  It seems that one result of adopting good soil health practices may be a great deal of variability in soil health lab results.  If you see your Haney test results bouncing around a lot, year-to-year, it does not necessarily mean that you are doing anything wrong.  It may mean that you are doing many things right!  We will explore this hypothesis further in coming years as we gather more data.
  • Published on

    Variability due to Grazing Animals & Organic Matter Inputs

    Variability due to Grazing Animals & Organic Matter Inputs
    In the top graph above, 71 sites with both grazing animals and organic matter inputs (OMI) are each represented by a quadruplet of data points connected by a vertical black line (a blue square for 2019, red circle for 2020, green triangle for 2021, and yellow diamond for 2022).  Each square-circle-triangle-diamond-black-line combo represents the Soil Organic Matter (SOM) values for one site for 4 years. According to the literature, SOM is supposed to be quite stable and very difficult to change, and yet we are seeing large swings in individual sites’ SOM data, especially when grazing animals are present or organic matter is imported to the site, as is the case in the top graph above.
    We only have 12 sites in our study which have no grazing animals or imported organic matter for 3 or more years.  The second lower graph shows that the variability in SOM values for these 12 sites is much less than for sites with grazing animals or organic matter inputs.

  • Published on

    Predicting the Soil Health of our 3 Main Crop Groups, PART 2

    Predicting the Soil Health of our 3 Main Crop Groups, PART 2
    Perennial Hay/Alfalfa/Pastures: The Pasture group has the highest average soil health scores of these three crop groups.  Although the Pasture group has lower supplemental water days and lower organic matter added, their very high days of living cover and very high grazing days, along with their very low tillage intensity and lower soil pH seem to more than make up for their water challenges, in terms of soil health.
    Commodity Row Crops: The Commodity crop group has the lowest average scores of these three groups.  Although they have done an excellent job of reducing their tillage intensity, that fact alone cannot make up for their high soil pH, lowest days of living cover and lowest organic matter added.  They have only 2/3rds of the water availability as the Commercial Veg/Flower/Fruit group, which explains their lower days of cover crops that often require fall seeding and fall water.  Inter-seeding cover crops aerially or when the main crop is still small are work-arounds but not always practical.  Low commodity prices mean the cost of additional organic matter inputs like compost and manure are hard to justify.
    Commercial Veg/Flower/Fruit: The Commercial Veg group has the highest tillage intensity by far, but also triple the organic matter inputs of the other 2 groups.  These huge organic matter inputs, along with their longer water season, greater use of cover crops, and lower soil pH overpower their intense tillage and boost their average soil health scores above the commodity crops’ averages.  Their longer water season means they can plant more fall cover crops and string together succession plantings for a longer growing season.  Their high value vegetables mean that they can afford organic matter input costs and hauling fees.
  • Published on

    Predicting the Soil Health of 7 Different Crop Groups: PART 2

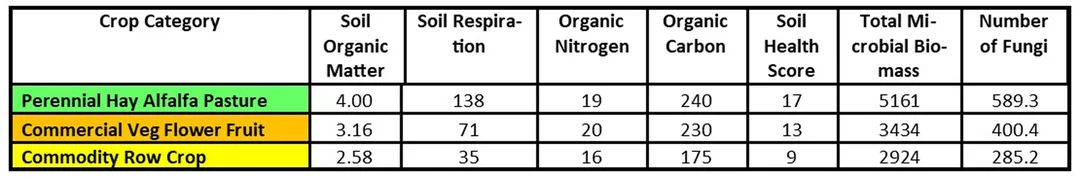
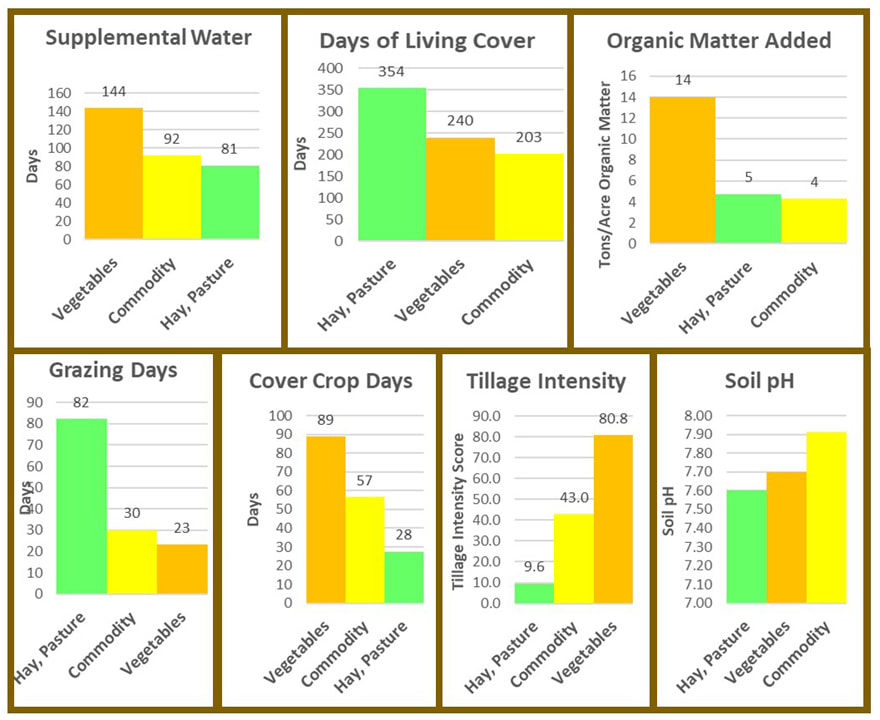
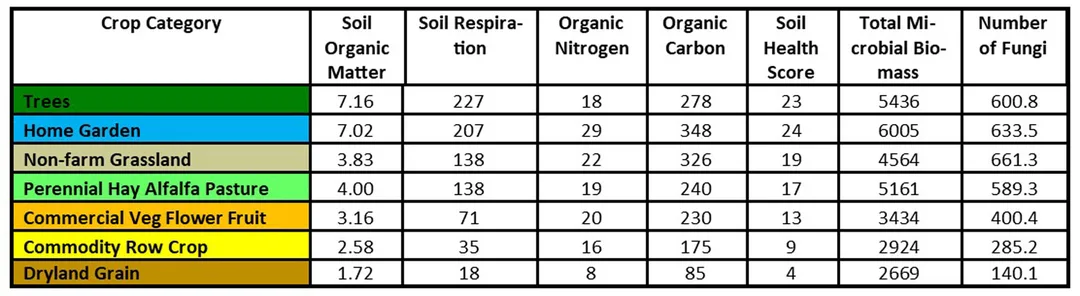
    If you guessed that Dryland Grains would have the lowest average soil health scores, and that Trees, Wild Grasslands and Home Gardens would have the highest scores, you would hit the jackpot.  Dryland Grains have no supplemental water, no organic matter inputs, the shortest days of living cover, and high pH, which all gang up to give the group some of the lowest soil health scores.  Home Gardens have the most supplemental water available, huge organic matter inputs, very low tillage intensity and low soil pH, which raises them to the top.  Although Grasslands and Trees have no supplemental irrigation water generally and no organic matter inputs, they have the most days of living cover, no tillage and the lowest soil pH, so they do very well too.  The chart below has the average soil health scores of each of our 7 crop groups, for Soil Organic Matter, Soil Respiration, Organic Nitrogen, Organic Carbon, Soil Health Score, Total Microbial Biomass, and Number of Fungi. 
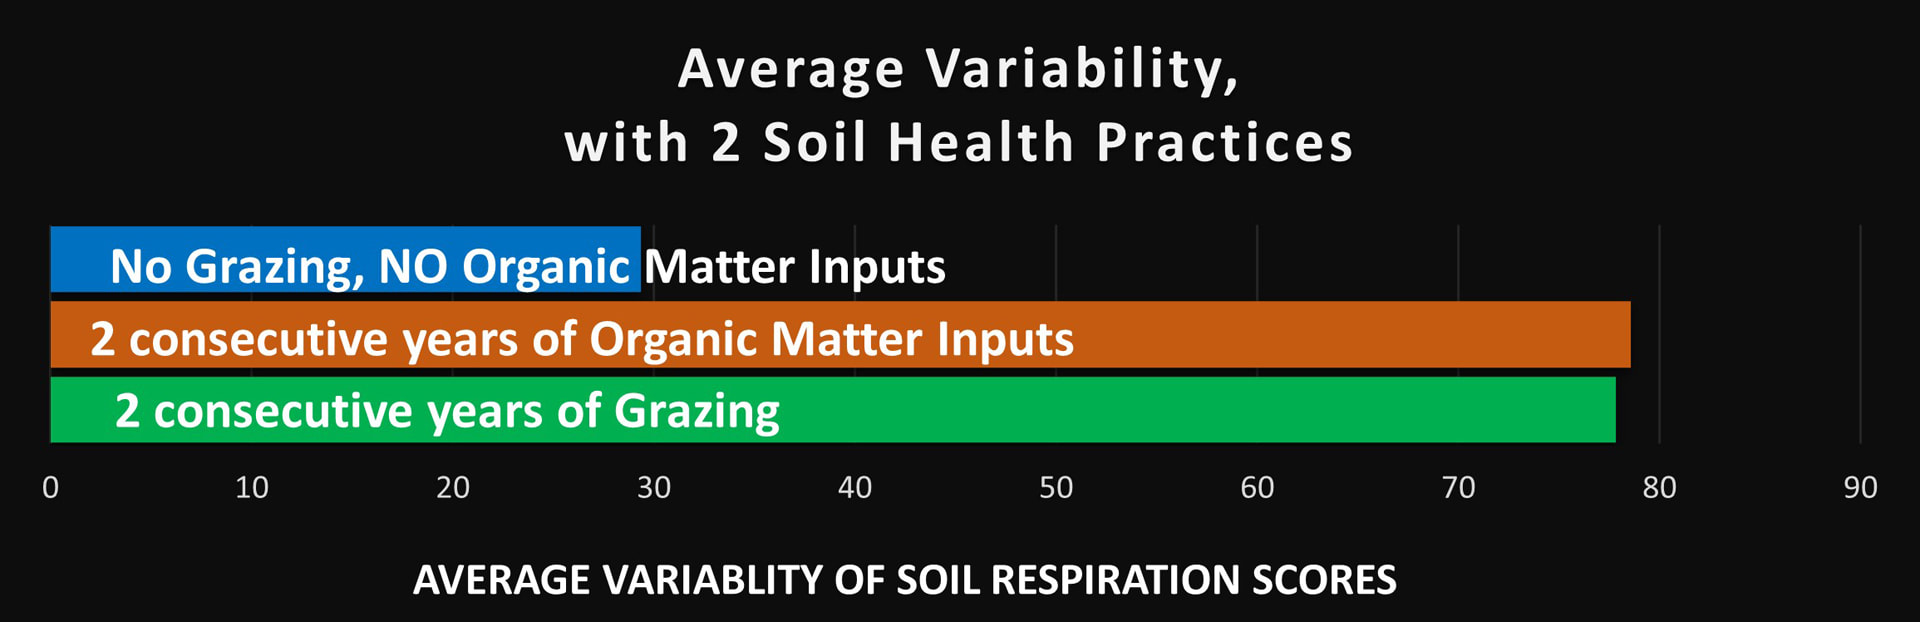
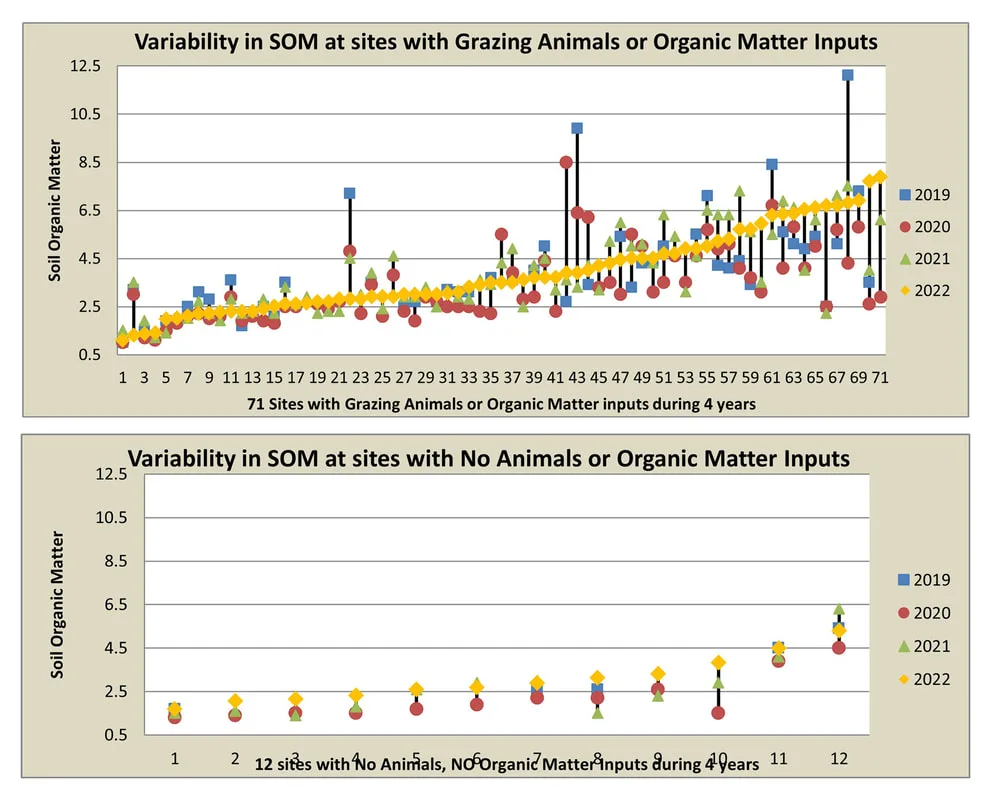
    Please remember that the numbers in these tables and graphs are averages, a mathematical construct.  There is no grower named “Average”, nor a field called “Average”.  We are talking about an imaginary mathematically constructed “average” site in these tables and charts.  Our real world is much more varied and complicated.
    Predicting the Soil Health of 7 Different Crop Groups: PART 2