• Published on

    Average Tillage Intensity has decreased, part 1.

    Picture
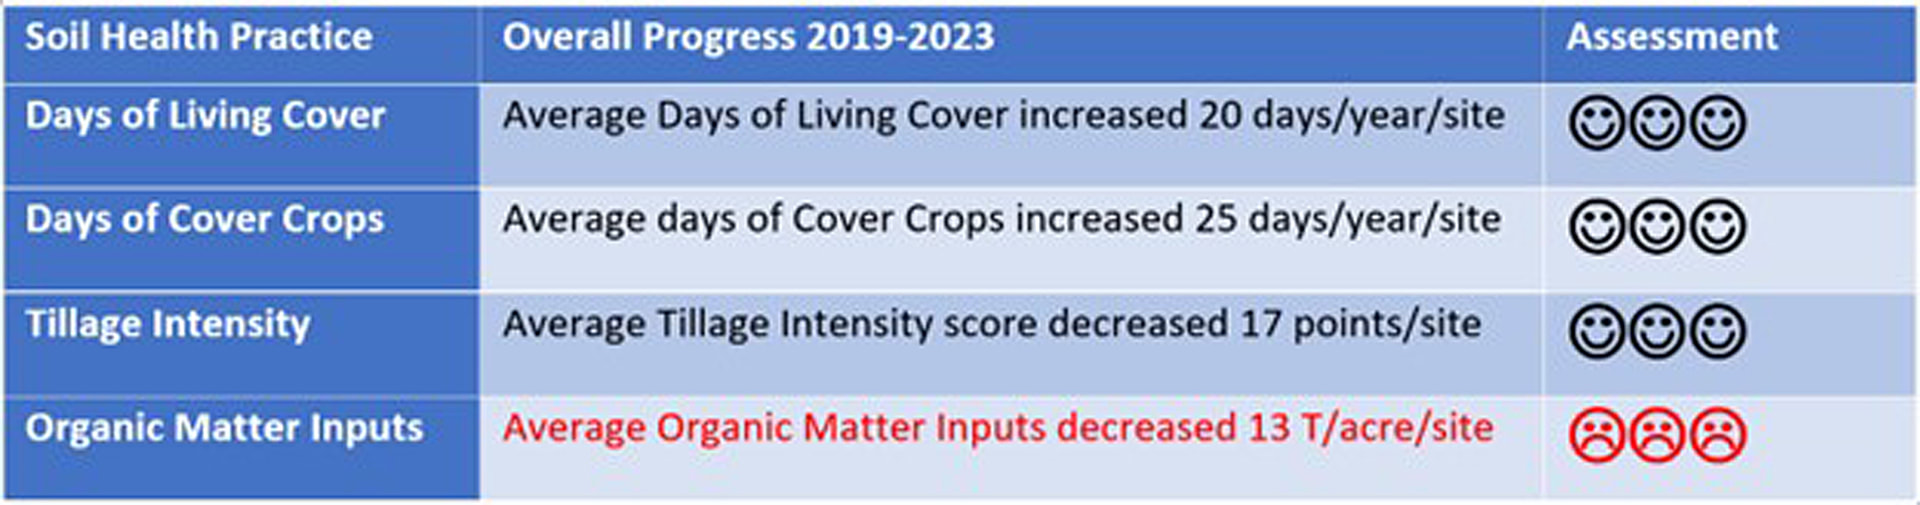
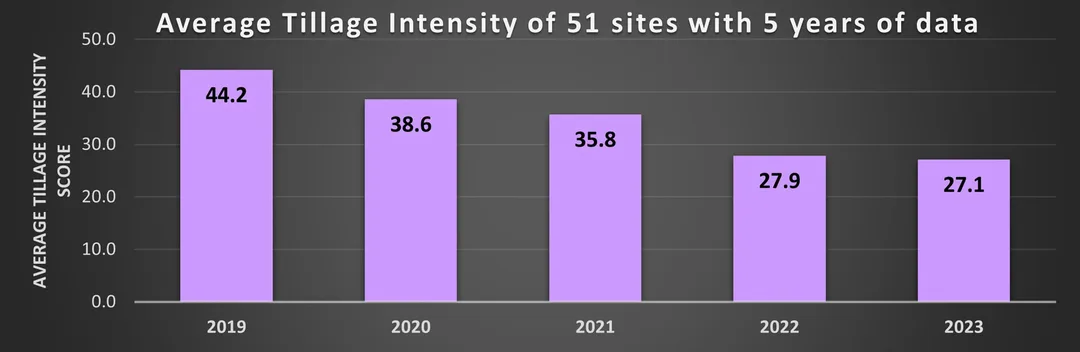
    When we examine just the 51 sites for which we have 5 years of data, we see that our growers have decreased their Tillage Intensity by 17 points over the last 5 years. This is very good news since lower tillage intensity is correlated with better soil health.  We use a Natural Resources Conservation Service soil erosion model to assign a soil disturbance score to all farm operations that compact or disturb soil.  For example, NRCS assigns a single pass with a subsoiler-chisel plow a score of 52.6, a disc harrow gets a score of 11.67, and hay cutting equipment gets a score of 0.15. We total all the scores from each implement used in a field in a calendar year to compute the tillage intensity score for each site.
  • Published on

    Most CSSHP growers have tried Cover Crops.

    Picture
    Two thirds of all our growers have planted cover crops in the last 5 years, with Commercial Vegetable and Commodity growers leading the way.  Only when a rancher inter-seeds a cover into an existing pasture or reseeds an annual field into a perennial crop do we credit a cover crop to that site, so we expect that cover crop use would be low for many of our established Perennial Hay/Alfalfa/Pasture sites.  Dryland grain sites, which depend on 420 days of fallow soil to store enough soil moisture for a biennial small grain crop, avoid cover crops because cover crops can deplete soil moisture.
  • Published on

    Average Days of Cover Cropping has increased.

    Picture
    Our growers have increased their days of cover crops on average by 25 days/site since 2019.  We examined the 200 sites for which we have cover crop data and found that our growers’ Cover Crop Use has increased for almost all our crop categories including Commercial Veg/Flower/Fruit, Commodity Row Crops, and Home Gardens. 
  • Published on

    Average Days of Living Cover has increased.

    Picture
    We have 5 years of data on the 51 sites which have been in the project since the very beginning, with data on both their management practices as well as their soil testing results.  The average Days of Living Cover on these 51 sites has increased by 20 days since 2019.  Our growers have increased their Days of Living Cover by increasing their use of cover crops, converting annual crops to perennial systems, and incorporating more fall-planted small grains into their rotations.
  • Published on

    Our Growers have made progress!!

    Picture
    The variability we continue to see in our lab results has thrown a great big monkey wrench into our ability to assess progress using only our lab results. However, we can still assess the progress our growers have made in increasing their use of tried-and-true soil health practices, including:
    • Increasing their Days of Living Cover
    • Increasing their use of Cover Crops
    • Decreasing their Tillage Intensity
    • Increasing their Organic Matter Inputs
    Our growers have made excellent progress incorporating 3 out of 4 of these soil health practices in the last 5 years.
  • Published on

    Variability with 2 Consecutive Years of Grazing or Organic Matter Inputs

    Variability with 2 Consecutive Years of Grazing or Organic Matter Inputs
    We sorted our sites into 3 groups and calculated the average variability for each group.  This bar graph shows that the groups which grazed animals or added organic matter to their sites for 2 consecutive years have approximately three times as much variability in their lab results as the group with NO grazing animals and NO organic matter inputs.