- Published on
Past Practices can explain some variability.
- Author
-
-
- Name
- Posts
- Posts
-

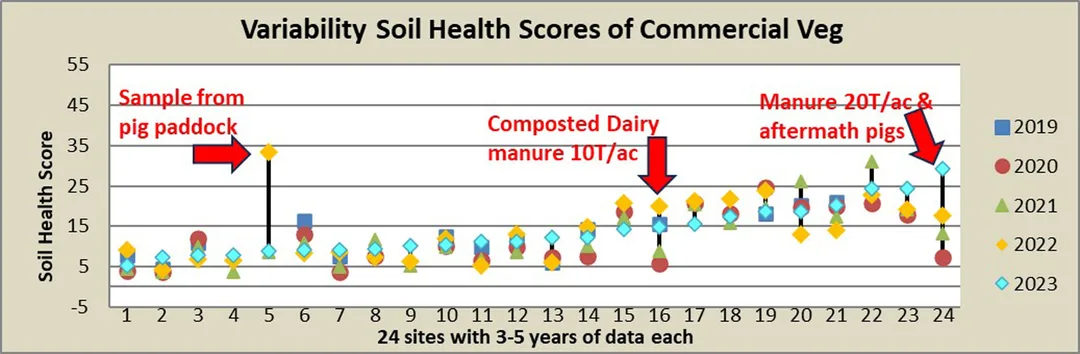
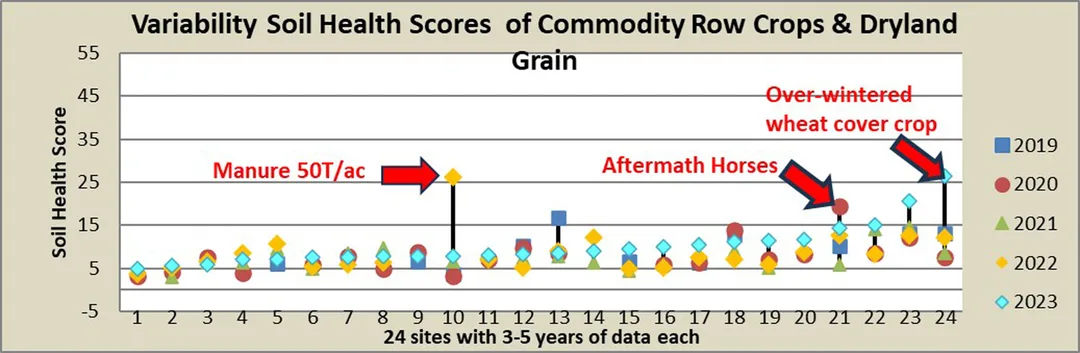
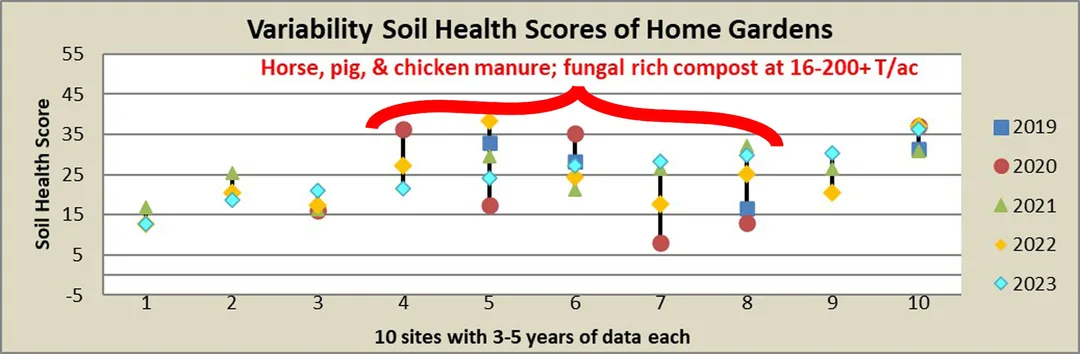
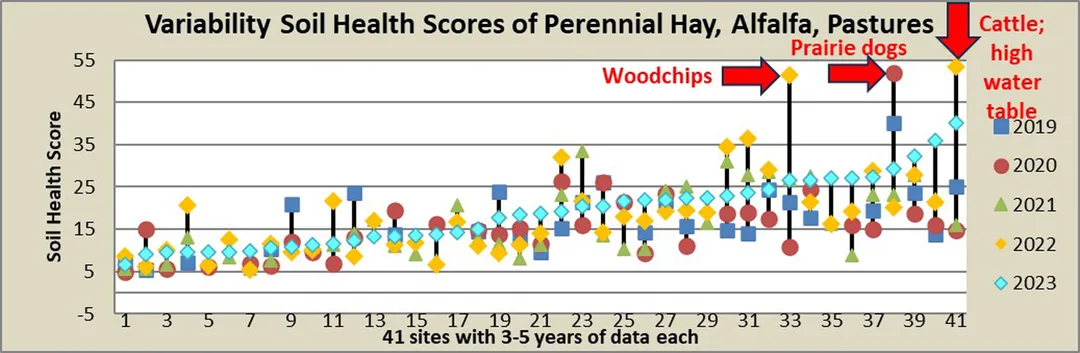
We continue to see a great deal of variability in our lab results when we compare sites with themselves year-to-year. We divided our sites into 4 crop categories (Commercial Veg/Flower/Fruit; Commodity Row Crops and Dryland Grains; Home Gardens; and Perennial Hay/Alfalfa/Pastures) and examined each category’s variability. These 4 graphs show that an examination of past practices can often explain some of the exceptionally big jumps in variability which we see in every crop group.
0 Comments