- Published on
Variability with 2 Consecutive Years of Grazing or Organic Matter Inputs
- Author
-
-
- Name
- Posts
- Posts
-

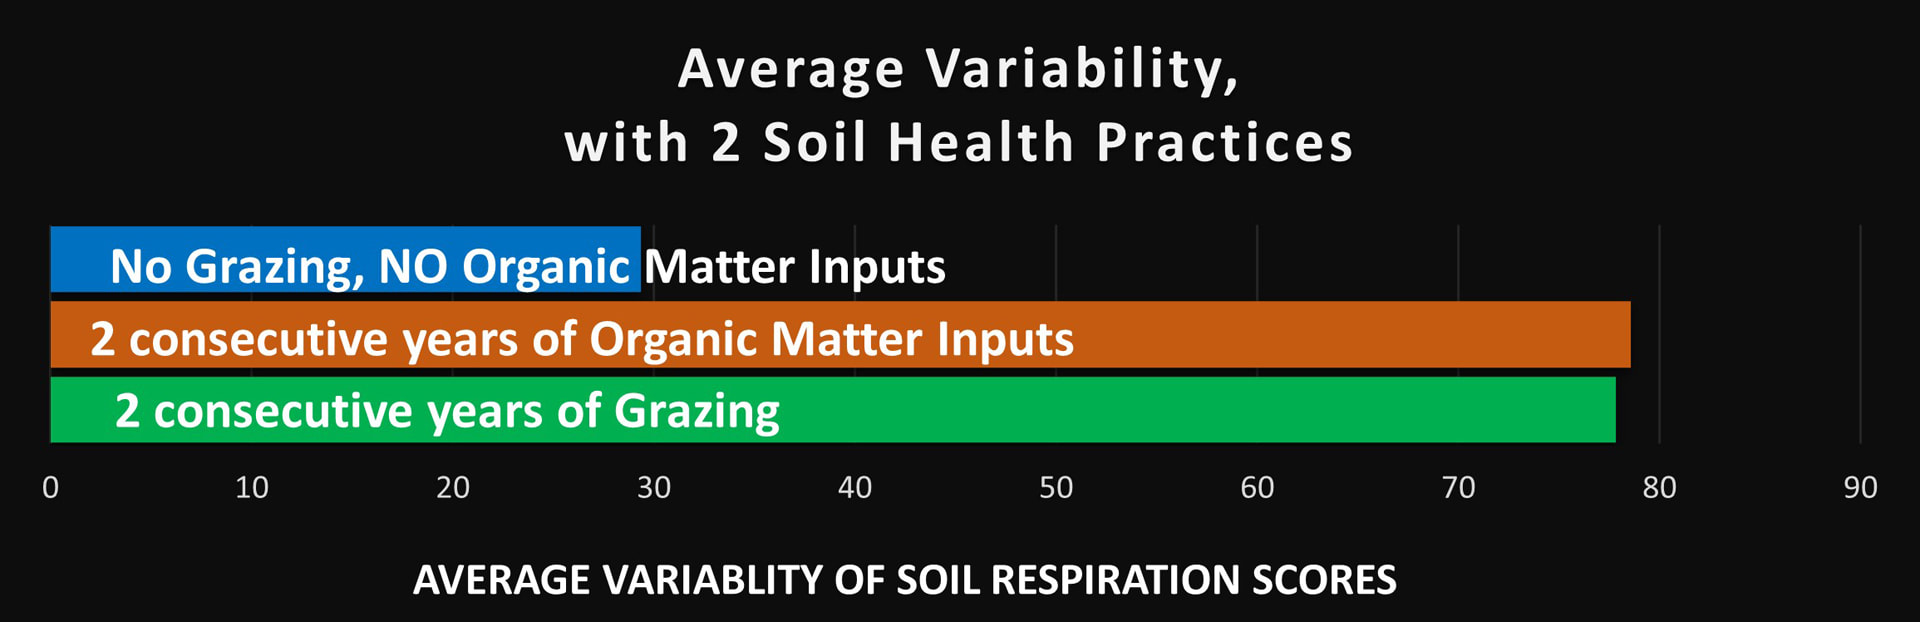
We sorted our sites into 3 groups and calculated the average variability for each group. This bar graph shows that the groups which grazed animals or added organic matter to their sites for 2 consecutive years have approximately three times as much variability in their lab results as the group with NO grazing animals and NO organic matter inputs.
0 Comments