The Citizen Science Soil Health Project
  • HOME
  • ABOUT THE PROJECT
    • ABOUT THE PROJECT
    • HOW WE TEST
    • SUPPORTING PARTNERS
  • OUR GROWERS
  • OUR FINDINGS
  • OUTREACH
    • VIDEOS
    • FORMS WE USE
    • NEWS & ARTICLES
  • More...
    • HOME
    • ABOUT THE PROJECT >
      • ABOUT THE PROJECT
      • HOW WE TEST
      • SUPPORTING PARTNERS
    • OUR GROWERS
    • OUR FINDINGS
    • OUTREACH >
      • VIDEOS
      • FORMS WE USE
      • NEWS & ARTICLES
Your Cart
  • HOME
  • OUR GROWERS
  • OUR FINDINGS
ABOUT THE PROJECT
  • ABOUT THE PROJECT
  • ABOUT THE PROJECT
  • HOW WE TEST
  • SUPPORTING PARTNERS
OUTREACH
  • OUTREACH
  • VIDEOS
  • FORMS WE USE
  • NEWS & ARTICLES
Your Cart

Tags

  • Alkaline-soil (2)
  • Alkaline Soil (5)
  • Compost (4)
  • Cover Crops (7)
  • Crop Groups (7)
  • Days Of Living Cover (7)
  • Grazing Animals (13)
  • Grower Feedback (4)
  • Irrigation Water (7)
  • Knowledge (4)
  • Longitude (2)
  • Manure (5)
  • Median (9)
  • Organic Growing Methods (4)
  • Organic Matter Inputs (14)
  • Past Soil Testing (1)
  • PH (8)
  • Phosphorus (3)
  • Progress (16)
  • Seasonal Variation (1)
  • Soil Organic Matter (8)
  • Soil Texture (2)
  • Tillage Intensity (10)
  • Variability (12)
  • Published on
    March 16, 2023

    Predicting the Soil Health of 7 Different Crop Groups: PART 1

    Alkaline Soil Cover Crops Crop Groups Days Of Living Cover Grazing Animals Irrigation Water Organic Matter Inputs PH Tillage Intensity
    Predicting the Soil Health of 7 Different Crop Groups: PART 1
    For each of our 7 crop groups, we calculated their average use of 6 different parameters that effect soil health: days of supplemental irrigation water, days of living cover, tons of organic matter added, number of grazing days, their tillage intensity score, and their soil Ph. 
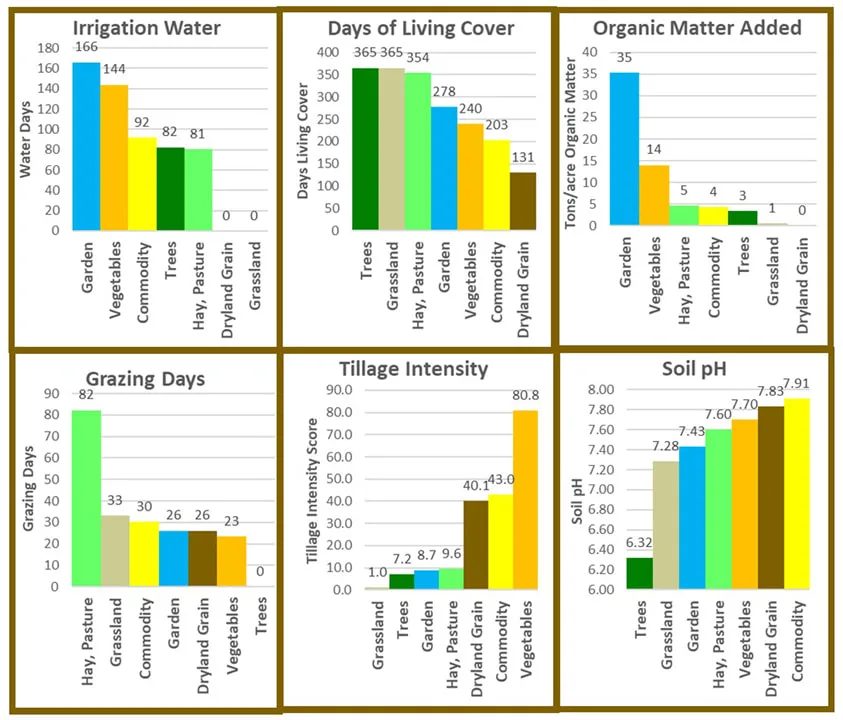
    We then examined those averages to see if we could predict which crop groups would have the lowest and highest soil health scores.  The graphs above show the average soil health practices for all 7 crop groups.  See if you can predict which crop groups will have the best and worst soil health scores, just by looking at their relative rankings on soil health practices.  Remember that you are looking for HIGH water days, HIGH days of living cover, HIGH organic matter inputs and HIGH grazing days, but LOW tillage intensity and LOW soil pH to predict the highest soil health scores. It’s just the opposite for the lowest soil health scores.
  • Published on
    August 11, 2022

    Tillage Intensity has a clear effect on soil health scores

    Median Tillage Intensity
    Tillage intensity affects soil health
    Read More
  • Published on
    August 11, 2022

    More intense tillage decreases several measurements of a soil’s health.

    Organic Matter Inputs Soil Organic Matter Tillage Intensity
    intense tillage decreases soil health
    Read More
  • Published on
    August 11, 2022

    Supplemental irrigation water improves our semi-arid lands’ soil health.

    Irrigation Water Median Tillage Intensity
    irrigation water affects soil health
    Read More
2 of 2 Next
HOME
ABOUT THE PROJECT
HOW WE TEST
SUPPORTING PARTNERS


The Citizen Science Soil Health Project
4340 N 13th St.
Boulder, CO 80304


Elizabeth@ElizabethBlackArt.com


OUR GROWERS
OUR FINDINGS


Picture
OUTREACH
VIDEOS
FORMS
NEWS & ARTICLES

Picture
This material is based upon work that is supported by the National Institute of Food and Agriculture, U.S. Department of Agriculture, under award number 2021-38640-34695 through the Western Sustainable Agriculture Research and Education program under sub-award project number G351-22-W9210. USDA is an equal opportunity employer and service provider.  Site powered by Weebly. Managed by pair Networks