The Citizen Science Soil Health Project
  • HOME
  • ABOUT THE PROJECT
    • ABOUT THE PROJECT
    • HOW WE TEST
    • SUPPORTING PARTNERS
  • OUR GROWERS
  • OUR FINDINGS
  • OUTREACH
    • VIDEOS
    • FORMS WE USE
    • NEWS & ARTICLES
  • More...
    • HOME
    • ABOUT THE PROJECT >
      • ABOUT THE PROJECT
      • HOW WE TEST
      • SUPPORTING PARTNERS
    • OUR GROWERS
    • OUR FINDINGS
    • OUTREACH >
      • VIDEOS
      • FORMS WE USE
      • NEWS & ARTICLES
Your Cart
  • HOME
  • OUR GROWERS
  • OUR FINDINGS
ABOUT THE PROJECT
  • ABOUT THE PROJECT
  • ABOUT THE PROJECT
  • HOW WE TEST
  • SUPPORTING PARTNERS
OUTREACH
  • OUTREACH
  • VIDEOS
  • FORMS WE USE
  • NEWS & ARTICLES
Your Cart

Tags

  • Alkaline-soil (2)
  • Alkaline Soil (5)
  • Compost (4)
  • Cover Crops (7)
  • Crop Groups (7)
  • Days Of Living Cover (7)
  • Grazing Animals (13)
  • Grower Feedback (4)
  • Irrigation Water (7)
  • Knowledge (4)
  • Longitude (2)
  • Manure (5)
  • Median (9)
  • Organic Growing Methods (4)
  • Organic Matter Inputs (14)
  • Past Soil Testing (1)
  • PH (8)
  • Phosphorus (3)
  • Progress (16)
  • Seasonal Variation (1)
  • Soil Organic Matter (8)
  • Soil Texture (2)
  • Tillage Intensity (10)
  • Variability (12)
  • Published on
    March 16, 2023

    Variability due to Grazing Animals & Organic Matter Inputs

    Grazing Animals Organic Matter Inputs Soil Organic Matter Variability
    Variability due to Grazing Animals & Organic Matter Inputs
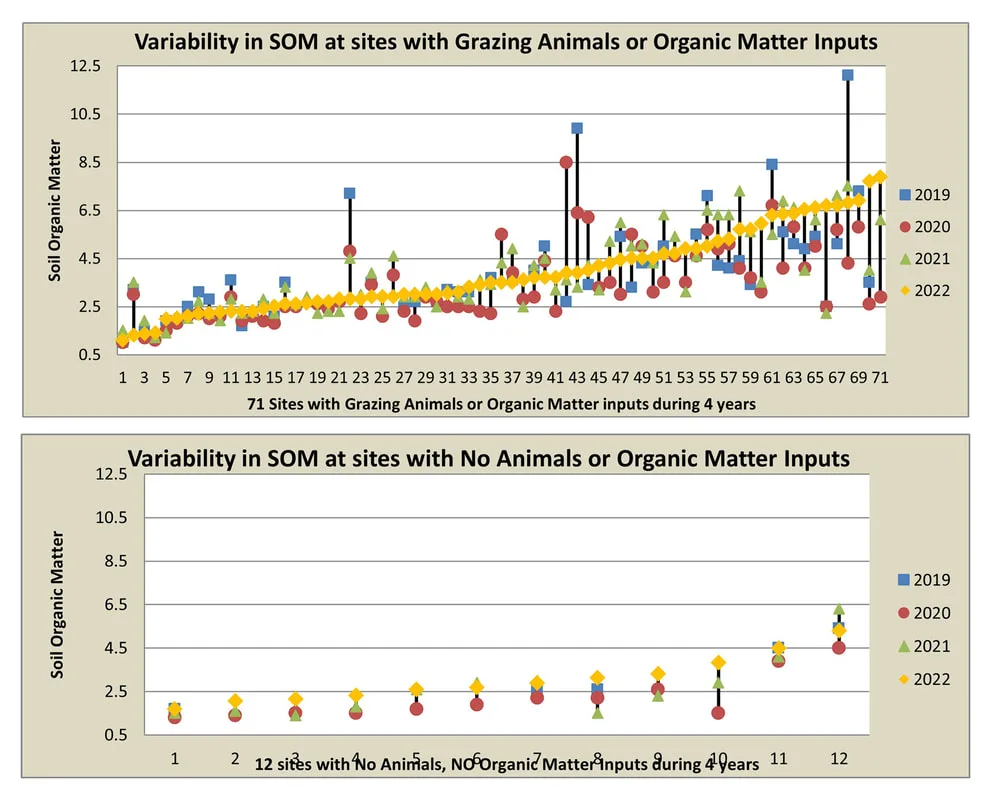
    In the top graph above, 71 sites with both grazing animals and organic matter inputs (OMI) are each represented by a quadruplet of data points connected by a vertical black line (a blue square for 2019, red circle for 2020, green triangle for 2021, and yellow diamond for 2022).  Each square-circle-triangle-diamond-black-line combo represents the Soil Organic Matter (SOM) values for one site for 4 years. According to the literature, SOM is supposed to be quite stable and very difficult to change, and yet we are seeing large swings in individual sites’ SOM data, especially when grazing animals are present or organic matter is imported to the site, as is the case in the top graph above.
    We only have 12 sites in our study which have no grazing animals or imported organic matter for 3 or more years.  The second lower graph shows that the variability in SOM values for these 12 sites is much less than for sites with grazing animals or organic matter inputs.

  • Published on
    March 16, 2023

    Predicting the Soil Health of our 3 Main Crop Groups, PART 2

    Alkaline Soil Crop Groups Days Of Living Cover Grazing Animals Irrigation Water Organic Matter Inputs PH Soil Organic Matter Tillage Intensity
    Predicting the Soil Health of our 3 Main Crop Groups, PART 2
    Perennial Hay/Alfalfa/Pastures: The Pasture group has the highest average soil health scores of these three crop groups.  Although the Pasture group has lower supplemental water days and lower organic matter added, their very high days of living cover and very high grazing days, along with their very low tillage intensity and lower soil pH seem to more than make up for their water challenges, in terms of soil health.
    Commodity Row Crops: The Commodity crop group has the lowest average scores of these three groups.  Although they have done an excellent job of reducing their tillage intensity, that fact alone cannot make up for their high soil pH, lowest days of living cover and lowest organic matter added.  They have only 2/3rds of the water availability as the Commercial Veg/Flower/Fruit group, which explains their lower days of cover crops that often require fall seeding and fall water.  Inter-seeding cover crops aerially or when the main crop is still small are work-arounds but not always practical.  Low commodity prices mean the cost of additional organic matter inputs like compost and manure are hard to justify.
    Commercial Veg/Flower/Fruit: The Commercial Veg group has the highest tillage intensity by far, but also triple the organic matter inputs of the other 2 groups.  These huge organic matter inputs, along with their longer water season, greater use of cover crops, and lower soil pH overpower their intense tillage and boost their average soil health scores above the commodity crops’ averages.  Their longer water season means they can plant more fall cover crops and string together succession plantings for a longer growing season.  Their high value vegetables mean that they can afford organic matter input costs and hauling fees.
  • Published on
    August 15, 2022

    More days of living cover  improves soil health.

    Cover Crops Days Of Living Cover Soil Organic Matter
    More days of living cover improves soil health
    Read More
  • Published on
    August 15, 2022

    Organic matter added to tilled fields improves soil health.

    Median Organic Matter Inputs Phosphorus Soil Organic Matter
    Organic Matter improves soil health
    Read More
  • Published on
    August 15, 2022

    Grazing animals in fields increases several measurements of a soil’s health.

    Grazing Animals Median Soil Organic Matter
    Grazing Animals improve soil health
    Read More
  • Published on
    August 15, 2022

    After 3 years, we cannot show progress in improving soil health at individual sites.

    Progress Soil Organic Matter Variability
    Variable progress improving soil health
    Read More
Previous 1 of 2
HOME
ABOUT THE PROJECT
HOW WE TEST
SUPPORTING PARTNERS


The Citizen Science Soil Health Project
4340 N 13th St.
Boulder, CO 80304


Elizabeth@ElizabethBlackArt.com


OUR GROWERS
OUR FINDINGS


Picture
OUTREACH
VIDEOS
FORMS
NEWS & ARTICLES

Picture
This material is based upon work that is supported by the National Institute of Food and Agriculture, U.S. Department of Agriculture, under award number 2021-38640-34695 through the Western Sustainable Agriculture Research and Education program under sub-award project number G351-22-W9210. USDA is an equal opportunity employer and service provider.  Site powered by Weebly. Managed by pair Networks